Overview of laser MPEs
These charts show the eye MPEs for various wavelength ranges. They may not include the changes made in the 2014 version of the ANSI Z136.1 standard. But these should be good enough to give a broad overview.
For continuous wave (CW) lasers
Power Density in watts per square centimeter, versus Exposure time in seconds, for selected wavelengths

Chart from Wikimedia Commons, created by Han-Kwang based on IEC 60825 formulas
For pulsed lasers
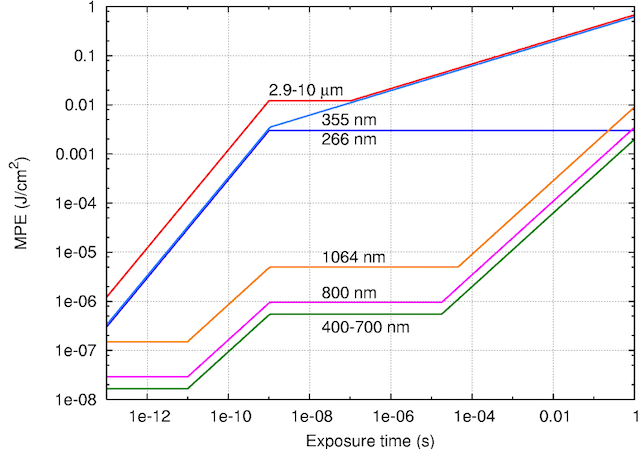
Energy in joules per square centimeter, versus Exposure time in seconds, for selected wavelengths

Table and text below from Wikimedia Commons, created by Han-Kwang based on IEC 60825 formulas
The graph above shows the Maximum Permissible Exposure (MPE) to light from lasers, as joules for a given exposure time. This is most suitable for use with pulsed lasers.
The vertical axis is the total energy which a person may be exposed to, per square cm. This is not the same as the power which a person can be exposed to. To determine the power a person can be exposed to, the energy must be divided by the time. In other words, if a lower powered laser is used, a person can be exposed for a longer period of time, before accumulating the same energy level.
As an example, a 5 mW laser puts out 5 mJ (5e-3 Joules) of energy per second. If the spread of the laser beam is 1 square cm, this point can be found by looking at the right column (labeled 1 second), and going up to the point 0.005 J/sq cm. This is therefore the maximum exposure for 1 second of light at 266-355 nm. On the other hand, if the laser beam width was only half that diameter, the energy per square centimeter would be 4 times as great, or 20 mJ (0.020 J/sq cm) in 1 second. To find the maximum exposure to this power level, the following procedure can be used:
- Begin at the point of exposure for 1 second (0.02 J/sq cm for our example).
- Move 1 line to the left (0.01 seconds), and 2 lines down (0.0002 J/sq cm, or 2 e-4). This is exposure to the same power level, but for 1/100th of the time, and therefore 1/100th of the energy.
- Draw a line through these 2 points.
This line indicates the maximum time a person can be exposed to that power level of laser, at that width. This line will intersect the green line (400 to 700 nm) at approximately 1e-4 seconds. It will intersect the 800 nm line at about 0.008 seconds, and the 1064 nm line at about 0.1 seconds.
It is important to remember that to use this graph, the power of the laser, the beam width (beam area) of the laser, and the wavelength of the laser must be known. Visible lasers all fall into the 400-700 nm range, which has the lowest level of acceptable MPE. In other words, we can be most easily injured by light at these levels.
For pulsed lasers
Energy in joules per square centimeter, versus Wavelength in nanometers, for selected exposure times

Table from Wikimedia Commons, created by Han-Kwang based on IEC 60825 formulas.
This has the same data as the Pulsed laser chart above, but shows the MPE for various exposure times versus wavelengths. The exposure times chosen are:
- 10 picoseconds, light blue line (co-linear at some wavelengths 400-1400 nm with the orange 100 fs line). Same as 0.00000000001 second.
- 100 microseconds, green line. Same as 0.0001 second/
- 1 microsecond, dark blue line (co-linear at some wavelengths 400-1400 nm with the purple 1 ns line). Same as 0.000001 second.
- 1 nanosecond, purple line. Same as 0.000000001 second.
- 100 femtoseconds, orange line. Same as 0.0000000000001 second
- 0.25 second, red line. For visible light, this is generally taken to be the maximum time before a natural aversion reflex (blinking, looking away) stops the exposure. In other words, an inadvertent, accidental or unwanted exposure to visible light generally uses the 0.25 second time.
